Paper Trading Hedge Fund
An automated hedge fund that trades the US stock market with simulated money, built so the number at the end of a run can actually be trusted.
The idea
Anyone can produce a trading backtest that looks brilliant. Let the strategy peek a few seconds into the future, fill its orders at the price that triggered them, leave out the fees and the spread, and a losing idea turns into a beautiful equity curve. The hard part isn't building a trading system, it's building one that refuses to flatter itself.
So that's the brief I set myself: an automated fund that trades the US market on paper, where every result has to survive a system designed to catch me out. No real capital, ever. A strategy should have to earn a track record before it's trusted with anything real.
The build
It's an event-driven system in Python. The decision everything else hangs off is that backtesting and live paper trading run through the same event loop and the same strategy code, with only the market data feed and the broker connection swapped underneath. A parity test proves it: both paths produce identical signals, orders, fills and final positions over the same market events. If a strategy ever behaved differently live than it did in testing, that's a fault in the architecture, not bad luck.
Underneath sits a proper double-entry ledger, the same accounting a real fund runs on. It has to balance after every single entry, and nothing is ever fudged to make it agree. Around it are the defences: the strategy only ever sees a masked view of the past, so asking for tomorrow's price raises an error instead of quietly working, orders never fill on the bar that triggered them, and a deliberately cheating strategy lives in the test suite so that if the traps ever stop catching it, the build fails.
Then there's the real cost of trading, which is where most home-built systems quietly lie. Regulatory fees on verified published rates, the spread, market impact, order latency, venue rejections, and a cap on how much of the day's volume a single order can be. Each one can be switched off on its own, and a report runs the strategy with everything off, then one component at a time, so I can see exactly what each is costing me.
Where it's at
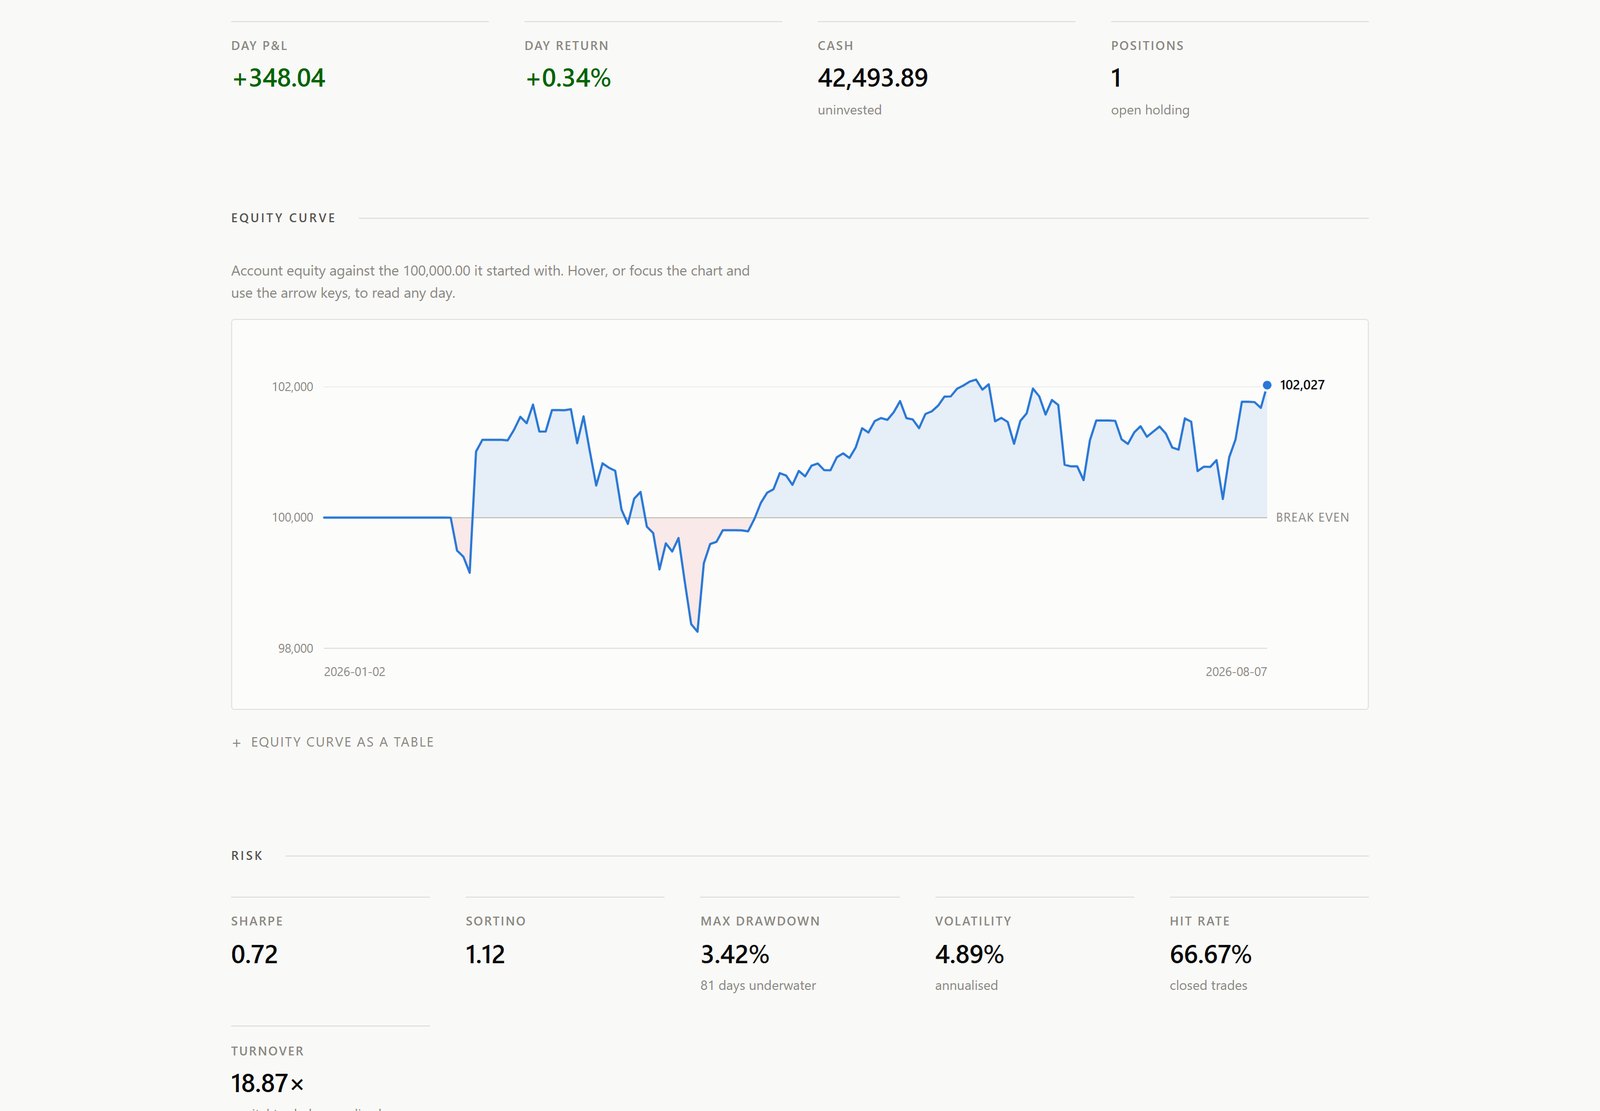
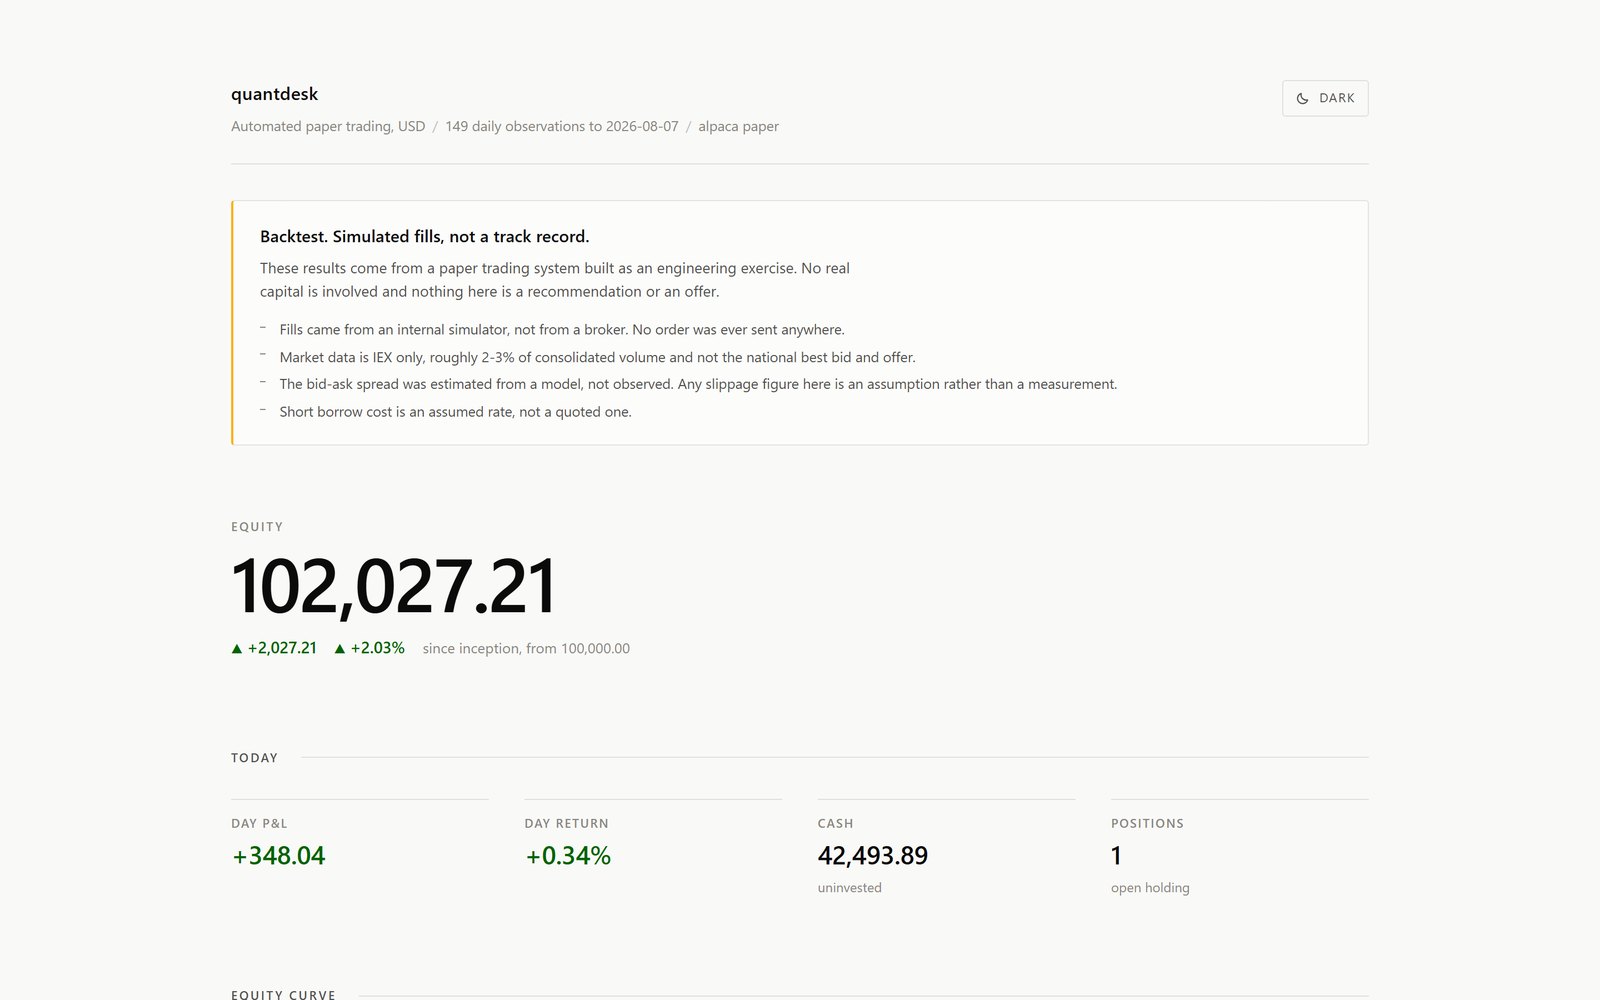
The system is built and tested end to end, running on real US market data, with results published to a tracker site. The paper account is wired up and hasn't taken its first live session yet.
The first real finding was the one that mattered. Run on minute bars, the strategy makes money right up until the costs go in, then loses it: trading around nine hundred times the account value over the test period turns a healthy paper profit into a genuine loss. That's a turnover problem rather than a cost problem, and it's exactly the result the whole build exists to surface. A more flattering system would simply never have told me.
Next is retuning for turnover, and then the first live paper session.